
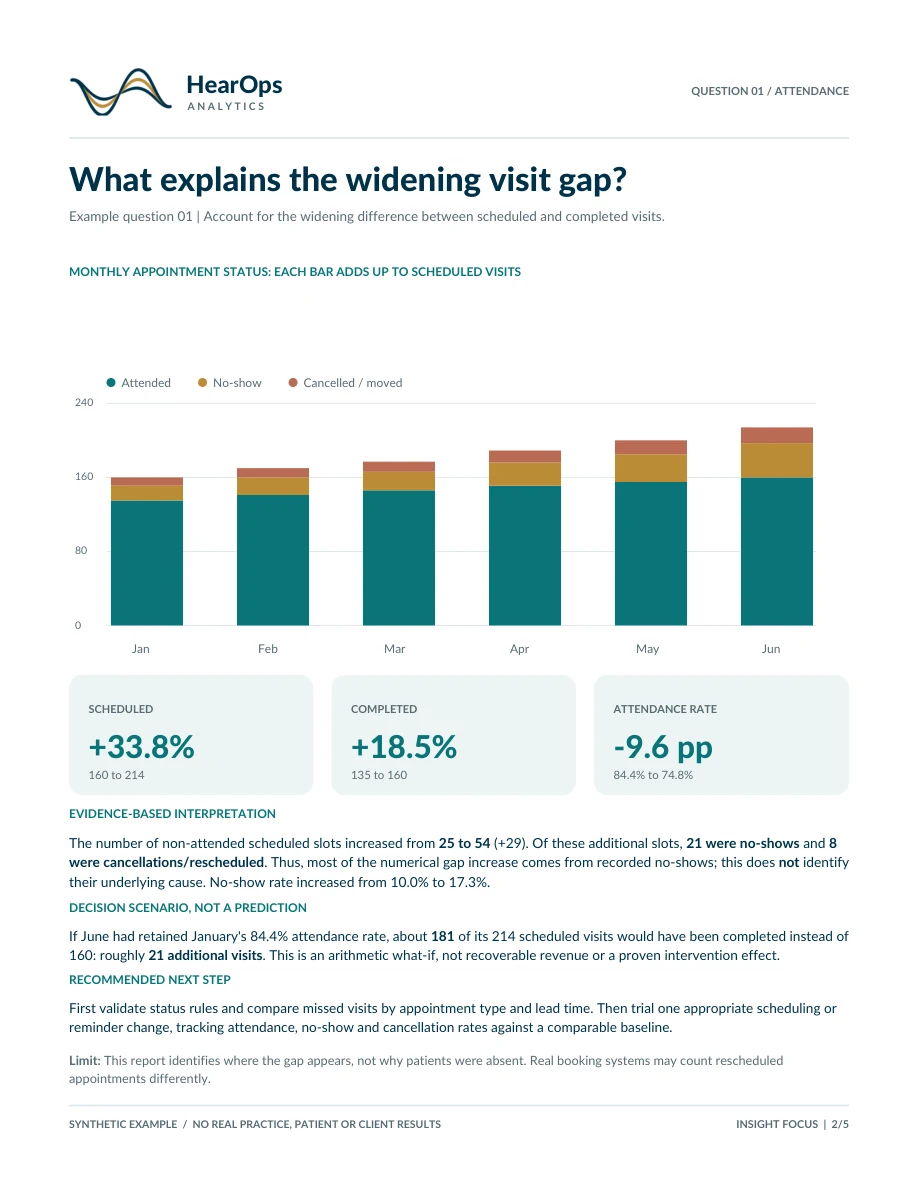
Non-attended scheduled slots increased from 25 to 54. The increase is largely in recorded no-shows, but the data alone cannot establish why those visits were missed. Next: verify scheduling statuses, then compare appointment types and reminder processes.
Example 01 / A closer look at existing reports
Insight Focus
A focused interpretation of existing business reports to clarify selected operational questions, distinguish evidence from assumptions, and suggest what to investigate next.
Illustrative, synthetic data · Cedar Hearing Clinic is fictional
01 / Example business challenge
What do the existing reports actually tell us?
The fictional practice already tracks appointments, referral inquiries and revenue. This example asks three illustrative questions, not a fixed set of client questions.
+33.8%Scheduled visits · Jan–Jun
+18.5%Attended visits · Jan–Jun
+4.6%Recorded gross revenue · Jan–Jun
02 / Data & analysis
Read connected metrics together.
We reconciled monthly appointment statuses and compared the changes in planned visits, completed visits, inquiry-to-booking rates and two broad recorded revenue categories.
The referral inquiry cohorts use a separate January–May origin period and 30-day follow-up through June; they are not the full monthly appointment population.
03 / Key insights & next steps
Three questions, clearer decisions.
Within separately tracked synthetic inquiry cohorts, provider referrals had a 76.9% inquiry-to-booking rate, above website (56.7%) and paid advertising (45.1%). This does not establish profit or marketing ROI. Next: confirm attribution and compare completed visits before making budget decisions.
Device gross revenue fell $4k as other-service gross revenue rose $7k; total recorded gross increased $3k. This describes a change in recorded composition, not the underlying cause. Next: validate device units, returns, posting dates and comparable sales periods.
These questions are illustrative; real projects are tailored to each practice's goals and suitable data.
04 / Full example report
Want the detailed analysis?
Read the five-page sample PDF for the visual breakdown, definitions, caveats and recommended next checks.