
Example 01 · Already have reports
Insight Focus
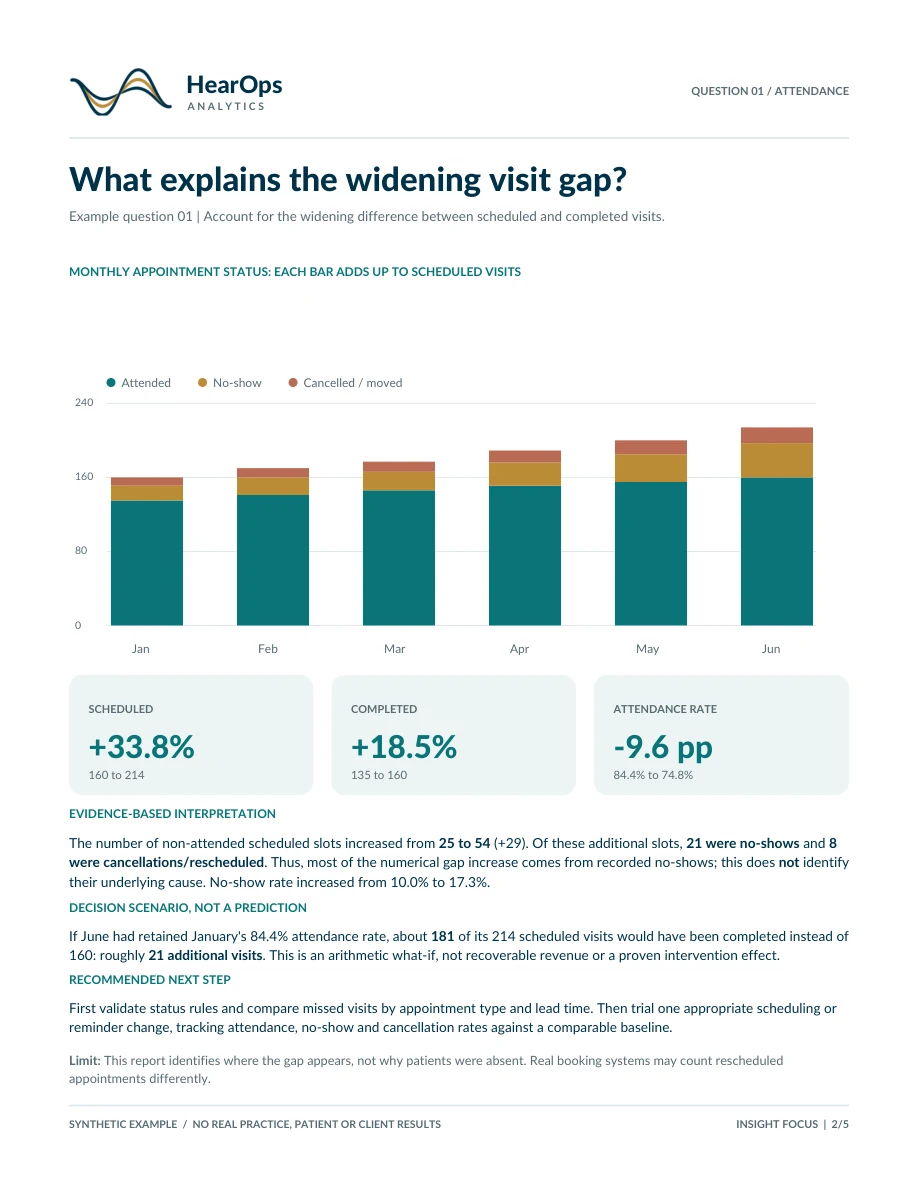
See how existing analytics can be examined to understand appointment gaps, referral inquiries and revenue mix — without rebuilding the reporting system.
Explore this example ↗Two examples. Two different starting points. Explore how we investigate existing reports or build useful analytics from operational records.
See how existing analytics can be examined to understand appointment gaps, referral inquiries and revenue mix — without rebuilding the reporting system.
Explore this example ↗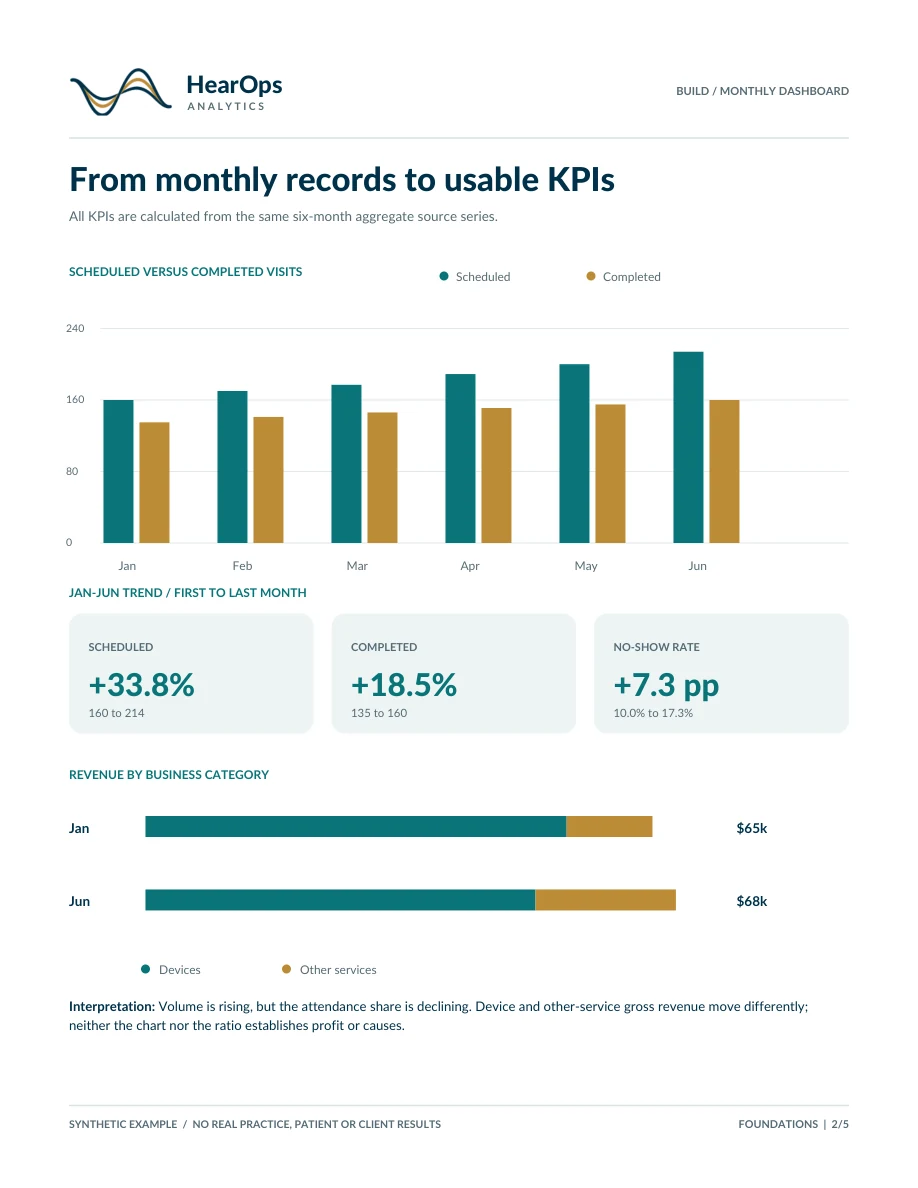
See how monthly operational data become defined KPIs, a dashboard, practical insights and a repeatable performance-tracking workflow.
Explore this example ↗Both cases use the same six months of synthetic data so you can compare the approaches directly. More advanced packages may include different scopes or conditional scenarios.