
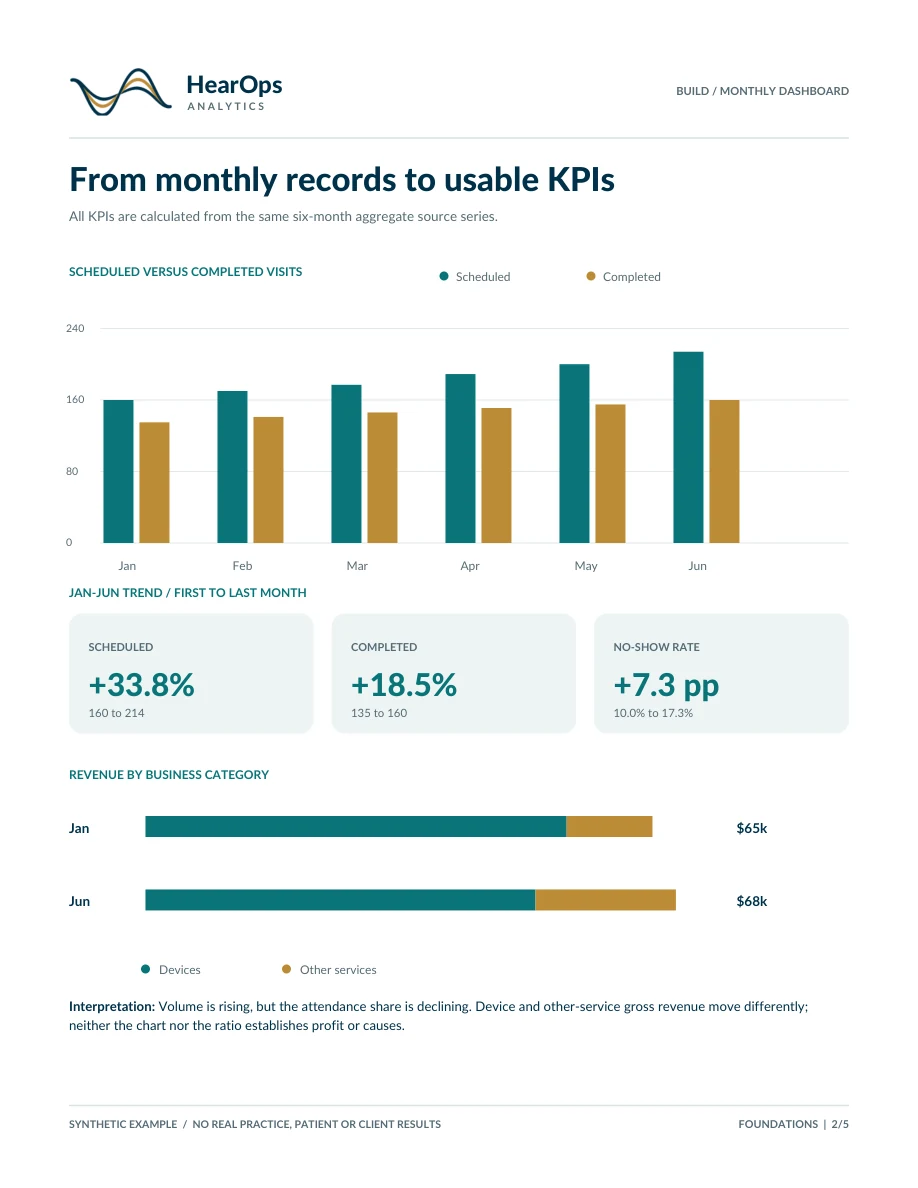
The no-show rate increased from 10.0% to 17.3% between January and June in this fictional dataset. Next: confirm categories and compare trends by appointment type before testing any intervention.
Example 02 / Building analytics from existing data
Performance Foundations
A baseline reporting workflow that turns monthly operational figures into defined KPIs, clear visuals, business questions and a practical tracking structure.
Illustrative, synthetic data · Cedar Hearing Clinic is fictional
01 / Example business challenge
The figures exist. The KPIs don't — yet.
This fictional practice has six months of monthly business records but no consistent performance dashboard. HearOps begins with reconciliation, definitions and trend reporting.
1,110Scheduled visits · 6 months
888Attended visits · 6 months
80.0%Weighted attendance rate
02 / Data & analysis
Build a reliable metric foundation.
We check whether scheduled appointments reconcile to completed, no-show and cancelled/rescheduled visits. We then define repeatable metrics and visualize attendance, no-show rate and recorded gross revenue categories.
A reusable tracking workbook can support consistent monthly reporting. These are non-clinical, aggregate business measures.
03 / Key insights & next steps
Make the dashboard useful for decisions.
Device gross revenue decreased from $54k to $50k while other-service gross rose from $11k to $18k. Next: check revenue mapping, device units and return/discount treatment.
Across the six-month series the weighted attendance rate was 80.0%. Next: use one consistent monthly template for comparable indicators and document changes before drawing conclusions.
The example shows a possible analytic workflow, not a guaranteed financial result or a mandatory set of questions.
04 / Full example report
Explore the complete dashboard.
View the five-page report to see the synthetic source figures, KPI definitions, visual results and suggested next checks.